Sample Size Calculation in Medical Research — A Complete Guide
Sample size calculation is one of the most asked-about — and most misunderstood — steps in medical research. Ask any MBBS student or postgraduate researcher what their sample size is, and most will give you a number without being able to explain how they arrived at it. Ask them during a thesis viva, and that gap becomes a serious problem.
This page explains exactly what sample size means, why it matters, how it is calculated for the most common study designs, and what factors influence it — in plain language, without unnecessary statistical jargon. Use our Sample Size Calculator tool below to compute your required sample size instantly for prevalence studies and case-control studies.
What is Sample Size and Why Does It Matter?
Sample size refers to the number of participants you need to include in your study to detect a meaningful difference or association with statistical confidence.
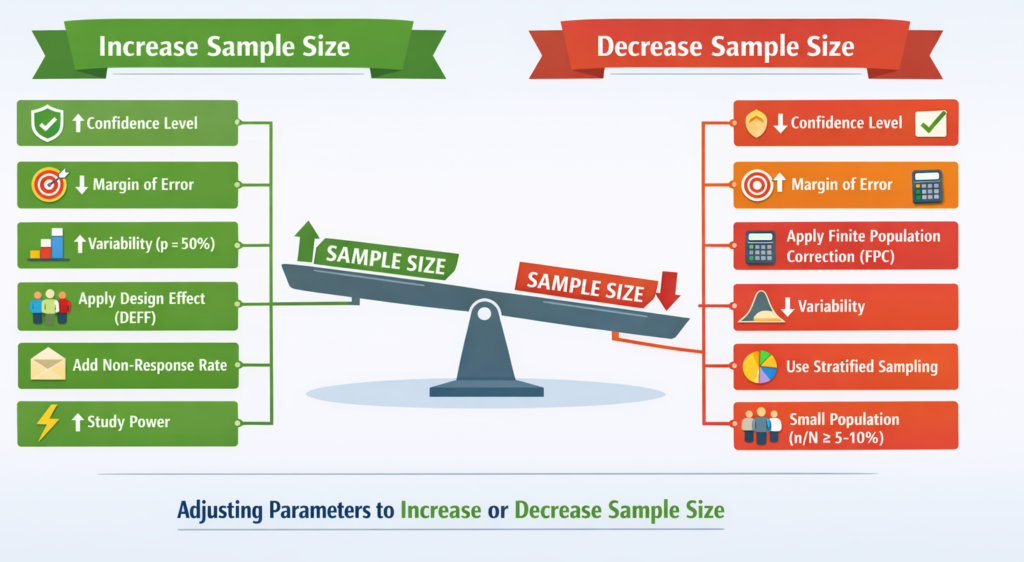
Getting the sample size right is critical for two reasons:
Too small a sample means your study is underpowered — it may fail to detect a real effect, leading to a false negative result. Your findings will be statistically insignificant even if a true difference exists. Ethics committees and journal reviewers will reject underpowered studies.
Too large a sample wastes resources, time, and unnecessarily exposes more participants to research procedures. It can also detect statistically significant differences that are too small to be clinically meaningful.
A properly calculated sample size ensures your study has enough statistical power to detect the effect you are looking for — making your findings credible, publishable, and defensible in your viva.
Key Concepts You Must Understand Before Calculating
Confidence Level (1 − α)
The confidence level tells you how certain you want to be that your results reflect the true population value. In medical research, the standard is 95% confidence, which corresponds to a Z-value of 1.96.
A 95% confidence level means that if you repeated the same study 100 times, 95 of those studies would produce results within your calculated margin of error.
For higher-stakes research, a 99% confidence level (Z = 2.576) is sometimes used.
Level of Significance (α — Alpha)
Alpha is the probability of making a Type I error — concluding there is an effect when there actually is none (a false positive). The standard alpha in medical research is 0.05 (5%), meaning you accept a 5% chance of a false positive result.
Statistical Power (1 − β)
Power is the probability of correctly detecting a true effect when one actually exists. The standard is 80% power (β = 0.20), meaning you accept a 20% chance of missing a real effect (false negative). Higher-powered studies (90%) are preferred for clinical trials.
Precision (d) — For Prevalence Studies
Precision, also called the margin of error or allowable error, is how close you want your sample estimate to be to the true population value. For most medical student projects, a precision of 10% (d = 0.1) is used. Tighter precision (5%) requires a much larger sample.
Expected Prevalence (p) — For Cross-Sectional Studies
This is your best estimate of how common the condition is in the population you are studying. It is taken from previous published studies, national surveys (like NFHS), or ICMR data. If no prior estimate is available, use p = 0.5 (50%) — this gives the maximum and most conservative sample size.
Odds Ratio — For Case-Control Studies
The odds ratio is a measure of association between an exposure and a disease. For sample size in case-control studies, you need an estimate of the odds ratio you expect to find and the proportion of controls exposed. These values come from existing literature.
Sample Size Formulas Explained
For Cross-Sectional (Prevalence) Studies — Cochran’s Formula
The most commonly used formula for prevalence studies is Cochran’s formula:
n = Z² × p × (1−p) / d²
Where:
- Z = Z-value for your confidence level (1.96 for 95%)
- p = expected prevalence (as a decimal, e.g. 0.3 for 30%)
- d = precision or allowable error (e.g. 0.1 for 10%)
Worked Example: You want to estimate the prevalence of hypertension among adults in your district. Previous studies suggest a prevalence of 30%. You want 95% confidence and 10% precision.
n = (1.96)² × 0.30 × 0.70 / (0.10)² n = 3.84 × 0.21 / 0.01 n = 80.6 → rounded up to 81 participants
If the population is small (under 10,000), apply the finite population correction formula to reduce this number further.
For Case-Control Studies
Sample size for case-control studies is calculated based on:
- The expected odds ratio
- The proportion of controls exposed to the risk factor
- Desired confidence level and power
This formula is more complex and is best computed using the calculator tool below.
Adding for Non-Response and Drop-Out
Always add 10–20% extra to your calculated sample size to account for non-response, incomplete questionnaires, or loss to follow-up. If your calculation gives you 81, recruit at least 90–100 participants.
Common Mistakes in Sample Size Calculation
Using the wrong formula for the study design. The Cochran formula is for prevalence (cross-sectional) studies. Using it for a case-control or cohort study will give you an incorrect and potentially misleading sample size.
Not justifying the prevalence estimate. Every value you plug into the formula must come from a cited source — a previous study, a national survey, or a pilot study. Using a value “because it seemed reasonable” will fail scrutiny in your viva and during peer review.
Forgetting to add for non-response. Always add 10–20% to your calculated minimum to ensure your final analysable sample is adequate even with drop-outs.
Rounding down instead of up. Always round sample size UP to the nearest whole number. Rounding down leaves you with an underpowered study.
Not reporting sample size justification in the methodology. Every dissertation and research paper must include a clear explanation of how the sample size was calculated, including the formula used, all values substituted, and the source of those values.
How to Report Sample Size in Your Dissertation
Here is a template you can adapt for your methodology section:
“The sample size was calculated using Cochran’s formula: n = Z²pq/d². Based on a reported prevalence of [X]% from [Author, Year], with a 95% confidence level (Z = 1.96) and 10% allowable error (d = 0.1), the minimum required sample size was calculated as [n]. Adding 10% for non-response, the final sample size was [n+10%].”
Use the calculator tool below to compute your sample size, then use this template to write your justification.
Cross Sectional Study and Case Control Study
Prevalence Study
Calculate sample size for cross-sectional studies
Case-Control Study
Estimate sample size per group
Frequently Asked Questions
What is the minimum sample size for a medical research study?
There is no universal minimum — sample size depends entirely on your study design, expected prevalence or effect size, desired confidence level, and precision. For a simple cross-sectional prevalence study with an expected prevalence of 50%, 95% confidence, and 10% precision, Cochran’s formula gives a minimum of 96 participants. For most MBBS dissertation projects, sample sizes between 80 and 200 are common and accepted by ethics committees, provided the calculation is properly justified.
What value of prevalence should I use if no prior data is available?
If no reliable prior estimate of prevalence is available for your specific population or setting, use p = 0.5 (50%). This is the most conservative estimate — it gives the largest possible sample size and ensures your study is adequately powered regardless of the true prevalence. This approach is widely accepted in medical research and should be stated clearly in your methodology with the justification that no prior local data was available.
What is the difference between confidence level and statistical power?
Confidence level (1 − α) refers to the probability that your confidence interval contains the true population value — it controls the Type I error rate (false positives). Statistical power (1 − β) refers to the probability of correctly detecting a true effect — it controls the Type II error rate (false negatives). Confidence level is used in all sample size calculations. Power (usually 80%) is additionally required when comparing two groups, such as in case-control or RCT designs.
Why do I need to add extra participants beyond the calculated sample size?
The calculated sample size is the minimum number of analysable responses you need. In practice, some participants will not respond, some questionnaires will be incomplete, and some enrolled patients may drop out or withdraw consent. Adding 10–20% to your minimum ensures that even after these losses, your final analysable dataset meets the required sample size. Failure to account for non-response is one of the most common reasons studies end up underpowered.
Can I reduce my sample size to make the study more feasible?
Yes — but only within acceptable statistical limits. You can reduce sample size by increasing allowable error (from 5% to 10%), reducing the confidence level (from 99% to 95%), or narrowing your study population. What you cannot do is arbitrarily choose a convenient number and then work backwards to make the formula fit. Every decision to modify the sample size parameters must be clinically and statistically justified in your methodology section.
This guide was written for medical students and healthcare professionals by the MResPilot team. Use the Sample Size Calculator above to compute your required sample size instantly.